Market Mix Modeling (MMM) — Introduction, Methodology, and Use case
Data is the oil of the 21st century and Analytics is the combustion engine!
Introduction
At Clairvoyant, we have been dealing with large data sets and the analytics obtained from it, for a long time. You can go through the services that we offer with respect to this particular sector here.
Over the past few decades, Marketing Mix Modeling (MMM) has been an indispensable tool to assist companies in optimizing the allocation of the budget to several types of media such as digital channels, television, print, radio, etc.
MMM is a technique that helps in quantifying the impact of several marketing inputs on Sales or Market Share. The purpose of using MMM is to understand how much each marketing input contributes to sales, and how much to spend on each marketing input. It is also used to optimize the spending budget over these different marketing inputs.

MMM helps in ascertaining the effectiveness of each marketing input in terms of Return on Investment. In other words, a marketing input with a higher return on investment (ROI) is more effective as a medium than a marketing input with a lower ROI.
The screenshot below depicts Clairvoyant’s end-to-end MMM solution dashboard which compares the current vs optimal marketing spends over different channels for a leading Insurance company. The left tab compares the Distribution of spends over different channels for current vs optimal scenario whereas the right tab talks about the important metrics like Total Budget, Cost Per Lead (CPL) and Number of Leads for the current and optimal scenario. It can be seen that a significant Lift can be achieved just by adjusting the spend on each channel. Our solution recommends the ideal spend per channel — but still keeping the overall budget (spend across all channels the same)

The screenshot below depicts another feature of Clairvoyant’s MMM solution which allows for the simulation of various scenarios. As an example, the % change in spends can be varied at a channel level by keeping or not keeping the total budget constant. It also talks about the important metrics as mentioned above in the right tab. E.g. Facebook spends have increased by 5%, Programmatic spends have decreased by 5% and Paid Search spends have increased by 15%.

Methodology
The following MMM methodology is stated by Ridhima Kumar in her article MMM-101. Link: https://towardsdatascience.com/market-mix-modeling-mmm-101-3d094df976f9
MMM leverages the Regression technique and the analysis performed is further used for extracting key information and insights.
Let’s talk about the various concepts and practical applications associated with understanding MMM.
- Multi-Linear Regression:
As mentioned above, MMM uses the concept of Multi-Linear Regression. The dependent variable could be Sales or Market share while the independent variables commonly used are Price, TV spends, Distribution, Promotions, and coupons etc. Nowadays, the Digital medium is highly used to increase brand awareness. Having said that, inputs like Digital spends, website visitors (Number of clicks, Number of Impressions, Number of Product page views etc) could also be used (if available) as inputs for MMM.
An equation is formed between the dependent variables and predictors. This equation could be linear or non-linear depending on the relationship between the dependent variable and various marketing inputs. There are certain variables like TV advertisement which have a non-linear relationship with sales. This means that the increase in TV GRP is not directly proportional to the increase in sales.
TV GRP is considered a non-linear variable because according to marketers an advertisement will create awareness among customers to only a certain extent. Beyond a certain point, increased exposure to advertisement would not create any further incremental awareness among customers as they are already aware of the brand.

The betas generated from Regression analysis, help in quantifying the impact of each of the inputs. Basically, the beta depicts that one unit increase in the input value would increase the sales/profit by Beta units keeping the other marketing inputs constant.
2. Linear and Non-linear Impact of predictors:
Certain predictors show a linear relationship with Sales i.e. as we increase these predictors, sales will keep on increasing. But predictors like TV Gross Rating point (GRP) do not have a linear impact on sales. An increase in TV GRPs will increase sales only to a certain extent. Once that saturation point is reached, every incremental unit of GRP would have less impact on sales. So, some transformations are done on such non-linear variables to include them in linear models.
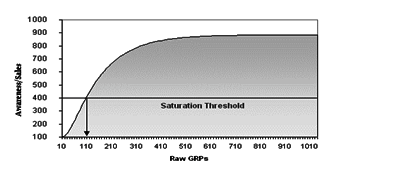
Increasing the amount of advertising increases the percent of the audience reached by the advertising, hence increases demand, but a linear increase in the advertising exposure doesn’t have a similar linear effect on demand. Typically each incremental amount of advertising causes a progressively lesser effect on demand increase. This is advertising saturation. Saturation only occurs above a threshold level that can be determined by Adstock Analysis.
To consider such non-linear predictors, it is transformed into adstock.
Adstock has two components:
(a) Diminishing Returns: Each incremental amount of GRP would have a lower effect on Sales or awareness. So, the sales generated from incremental GRP start to diminish and become constant. This effect can be seen in the above graph, where the relationship between TV GRP and sales in non-linear. This type of relationship is captured by taking an exponential or log of GRP.

(b) Carry-over Effect: The impact of past advertisements on present sales is known as the Carry-over effect. A small component termed as lambda is multiplied with the past month GRP value. This component is also known as the Decay effect as the impact of previous months’ advertisement decays over time.
3. Base Sales and Incremental Sales:
In MMM, sales are divided into 2 components:
(a) Base Sales: It is sales due to brand equity built over the years. Base Sales are usually fixed unless there is some change in economic or environmental factors.
(b) Incremental Sales: Sales generated by marketing activities like digital spends, TV ads and promotions etc. Total incremental sales are decomposed into sales from each input to calculate the contribution to total sales.
4. Deep Dives
The results generated from the Regression model are used further to perform deep-dive analysis i.e. assess the effectiveness of each campaign by understanding which campaigns work better than the other ones by calculating Return on Investment (ROI) for each campaign.
E.g. Contribution from TV = β * TV Spends
5. Budget Optimization
MMM helps in optimizing future spends and maximizing effectiveness. Using this approach, the mediums which are working better than the other ones are identified. Hence, budget allocation is done by shifting money from low ROI mediums to high ROI mediums thus maximizing sales while keeping the budget constant.
Usecase
In a typical ‘from thinking to buying’ customer journey, a customer goes through multiple touchpoints before zeroing in on the final product to buy.
As marketing moves more and more towards the consumer-driven side of things, identifying the right channels to target customers has become critical for companies. This helps companies optimize their marketing spend and target the right customers in the right places.
Let’s consider the data for a leading Insurance company in India. They wanted to understand the contribution of each channel in conversion (product purchase or becoming a lead) and eventually optimize the marketing spends on each channel. In our case, the target variable was ‘Number of Leads’. The model was prepared using daily level data after aggregations and the data for the past 2 years.
The table below shows multiple data sources we have used for creating an MMM model:
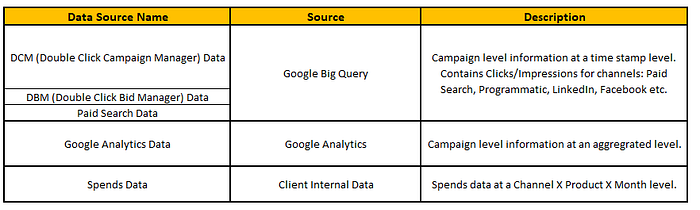
The data sources mentioned above were used to create an Analytical Dataset i.e. Modeling data. Below are the results of the Regression model along with Model statistics:
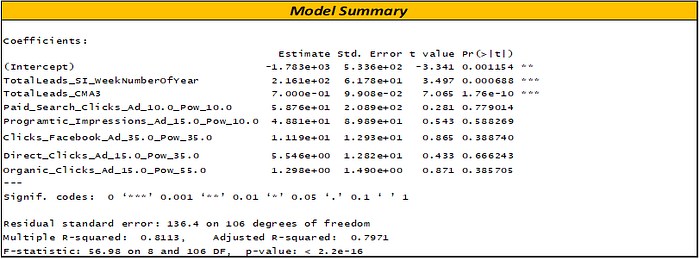
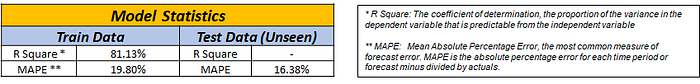
The robust model is finalized only when the signs of variables make business sense and the model statistics are very good i.e. it performs well on Train as well as Test data. After this crucial step, the next step is to see the percentage contribution in Sales from different channels and Base component. Once, this step is completed, the next step is to optimize the spends on different channels by maintaining a constant total budget.
Final result: After optimizing the spends on different channels while keeping the total budget constant, we have seen a Lift of 10.2% on Sales. In Marketing, Lift represents an increase in sales due in response to promotions or advertising.
Resources referred: